HOW WE HELPED
The I-695 Interchange at I-70 (Triple Bridges) Project will address aging 1960s infrastructure and improve vehicular mobility by replacing all bridges within the interchange. Our initial brief was to develop a survey to collect public feedback on aesthetic preferences and general project concerns. Seeing opportunities for interactivity and analytics reporting beyond what a standard survey could provide, we collaborated with SHA stakeholders to rapidly design and deliver a custom survey web application and database tailored to their needs.
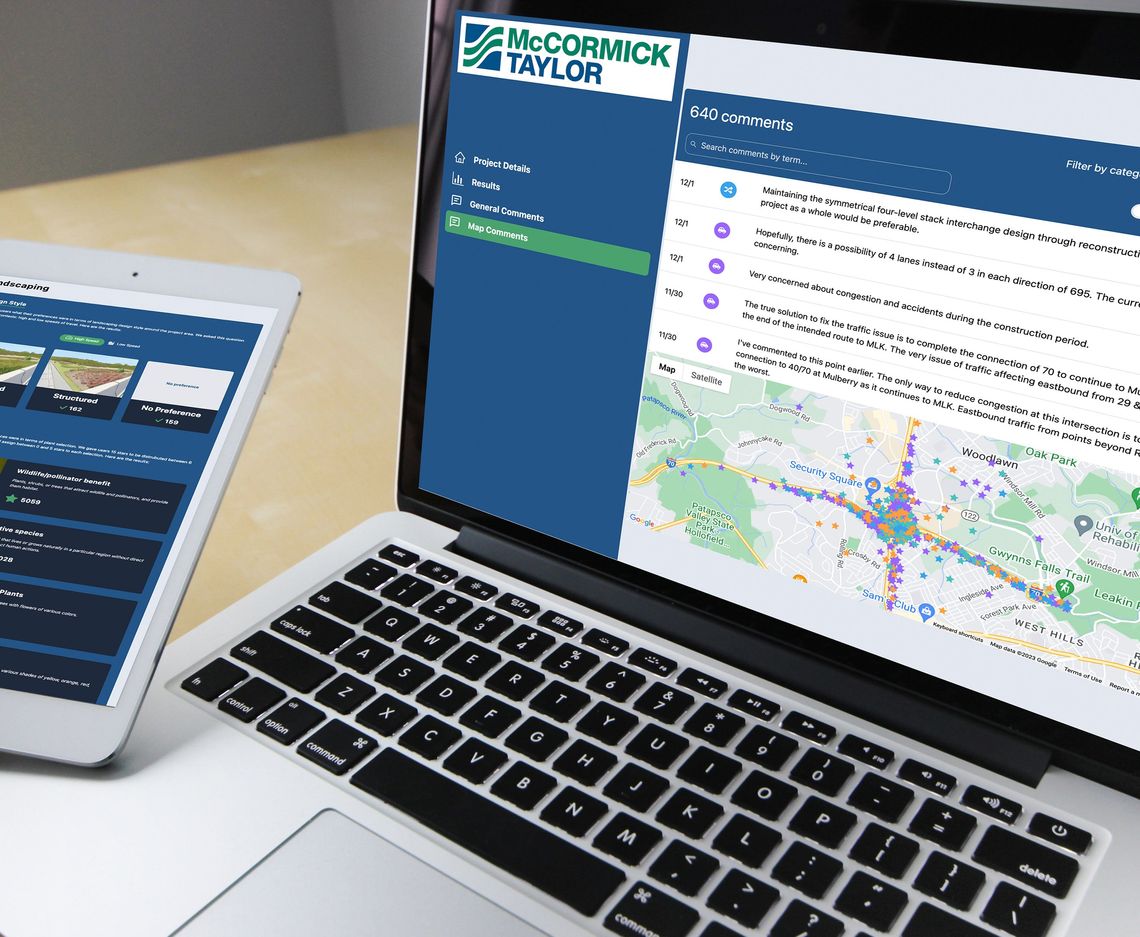
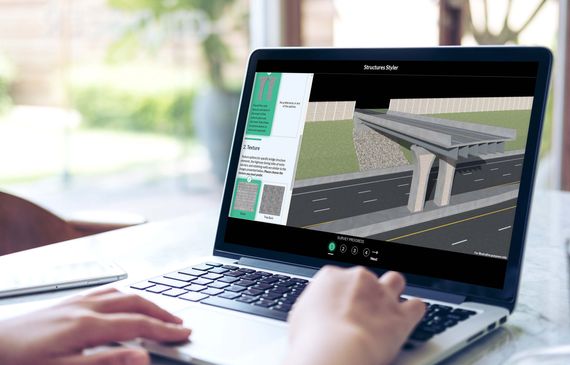
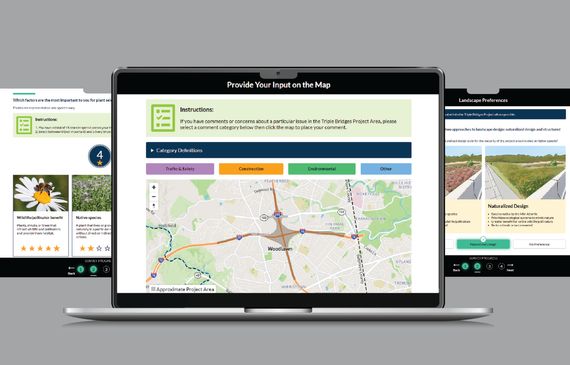
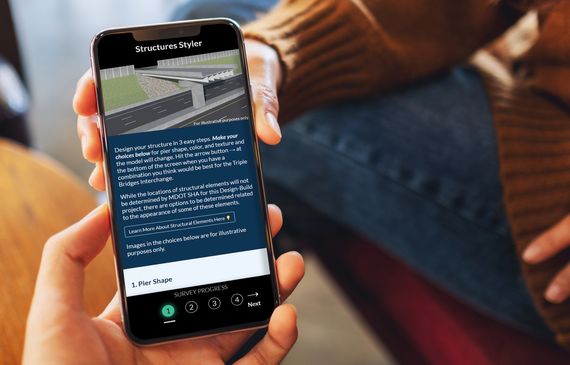
The app utilizes several novel features including an interactive bridge builder tool. This feature allows participants to select from a menu of various bridge pier types, concrete textures, and stain colors to dynamically alter a 3D rendering of a bridge in real-time. The participant’s selected combination is saved to the survey database when they move on to rank their landscape preferences on the next screen. This page incorporates a star rating system using a limited number of stars to allow participants to identify their favorite landscape treatments, which are depicted visually. To capture feedback about specific areas, participants next pinned comments to an interactive map to call out special areas of concern or appreciation. On the last screen, participants were encouraged to provide additional demographic information about themselves.
To better accommodate underserved and vulnerable populations, survey instructions were offered in multiple languages and the app allowed for full keyboard and screen reader accessibility. The app also provides a private dashboard for stakeholders that visualizes survey participation and public sentiment metrics data in charts and graphs.